In this series I’ll show how to create a data pipeline and visualize the results in Data Studio. I’ll use public records from the City of Orlando’s Active Calls web page. Later I’ll enrich the data and blend it with other data sources.
The active calls web page is actually just an XML document linked to an XSLT style sheet for presentation. This is great as it means I don’t have to do any dodgy web-scraping, but bad as my visualization tool (Data Studio) can’t consume XML. My pipeline will need to convert the data into a CSV format.

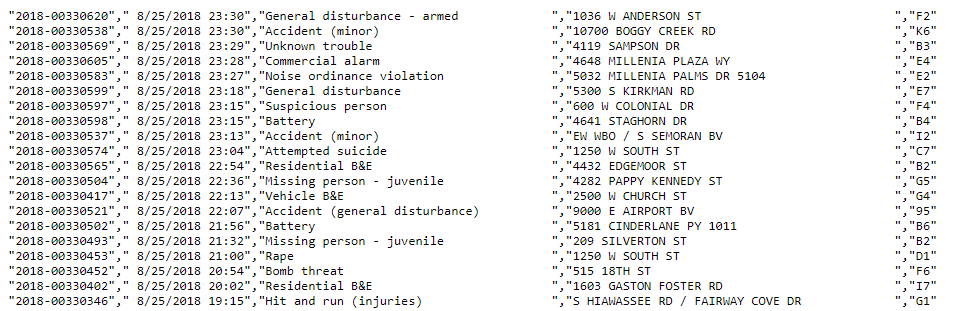
The file contains 5 key pieces of information I’ll need to extract, transform, and then load into storage:
- Incident Id
- Date
- Description
- Location
- District
Down the road I’ll extend the model to include latitude & longitude, which I’ll resolve via the Google Maps API. For now I’ll need to store the values in a CSV format (which can be more easily consumed by Data Studio). The final result should look like the image below…
Setup
Start by logging into the cloud console and clicking the drop down project selector along the top. Then click New Project…

Give the project a unique name and click create…

Create a Storage Bucket to house the CSV files…

Give the bucket a meaningful name and choose the cheaper regional storage class…

As the project grows, additional storage buckets will be created to isolate environments (dev, testing, prod, or other sources). For now I can move on and create a service account. This account will create and manage resources, as well as store & analyze data…

After clicking Create I’ll need to save the downloaded private key. For now I’ll place it somewhere my script can access.

Creating a Python Script
I’ll be developing everything locally using python and Visual Studio Code. It’s all free and relatively easy to work with. Later I’ll upload the script to a compute instance or app engine…

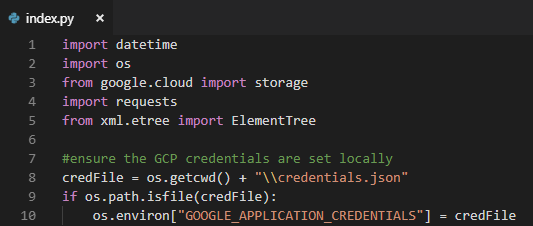
At the top of the script I imported the libraries I needed…
- datetime — formatting of today’s date for filename
- os — let’s me force the GCS credentials to be my private key
- google.cloud.storage — used to read/write daily CSV file in a storage bucket
- requests — used to download the XML source
- xml.etree.ElementTree — let’s me work with XML files I download via requests
Once all of the libraries have been imported, I check for a local credential file and push its’ location into the required environment variable. Later when I push this onto a compute instance I’ll leave the credential file out…
The first major task in my script is to fetch today’s CSV from the storage bucket…


If I inspect the file I can see it is indeed in CSV format…

Create Compute Instance
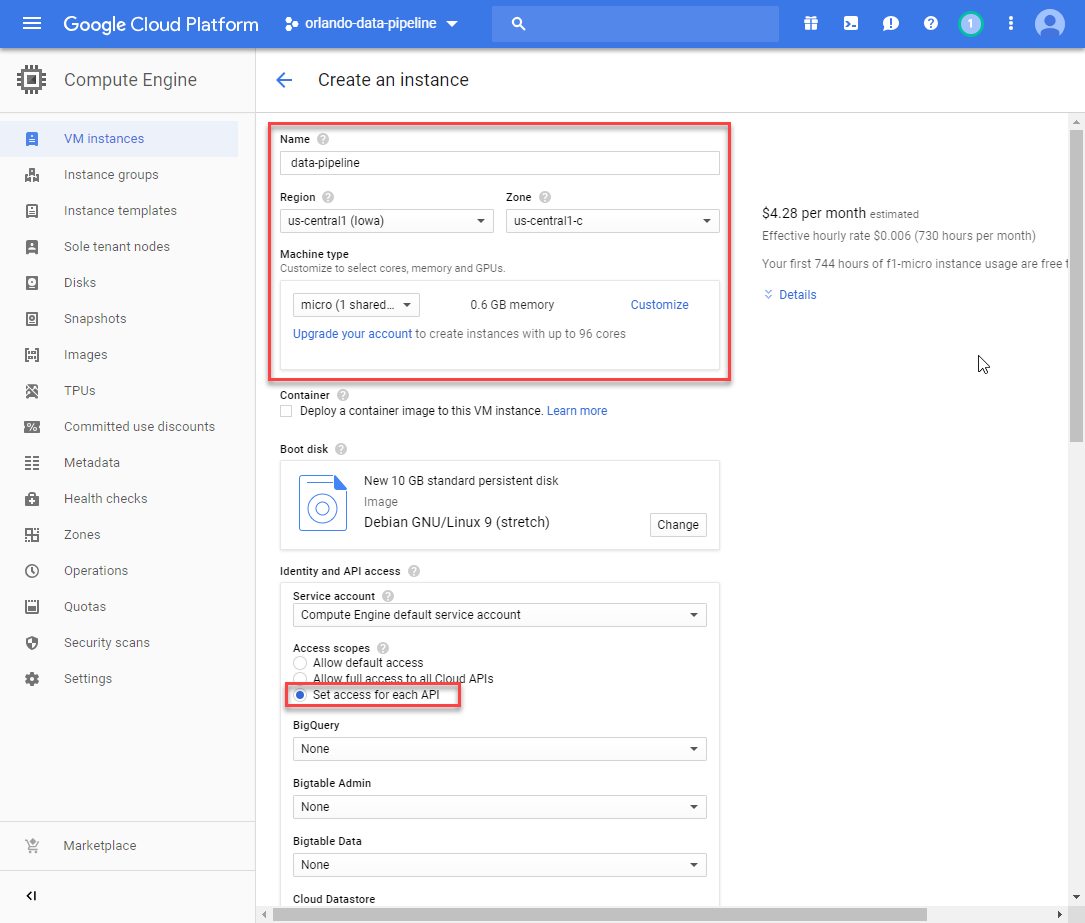
One of the great things about Google Cloud Platform is that you can run an instance of the micro VM for free. I’m going to create one and then push my code onto it. You must ensure that you enable the storage API for read/write before saving…
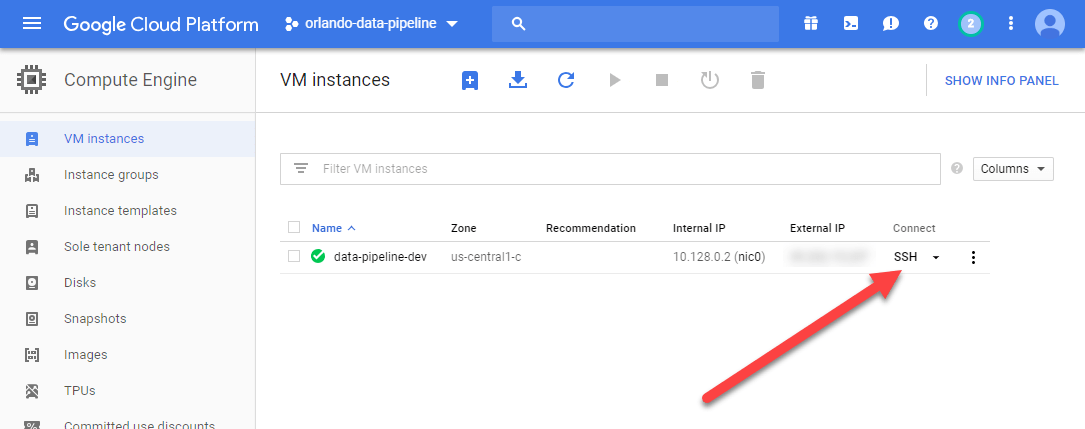
Now that it has been created I can remote onto it via SSH…
As always, the first thing to do is run an update and then install git…

Next comes python pip…
sudo apt-get install python-pip
And then the project dependencies…
pip install –upgrade google-cloud-stoarge
Next I can pull down my code…
git clone https://github.com/aberrantCode/orlando-data-pipeline.git
Now I can try running my script…

Yay, it runs! Now I need to schedule it. I’ll need to update the permissions first…
sudo chmod a+x ./index.py
Now I need to create a schedule to run this script….
crontab -e
Add a line for this script…
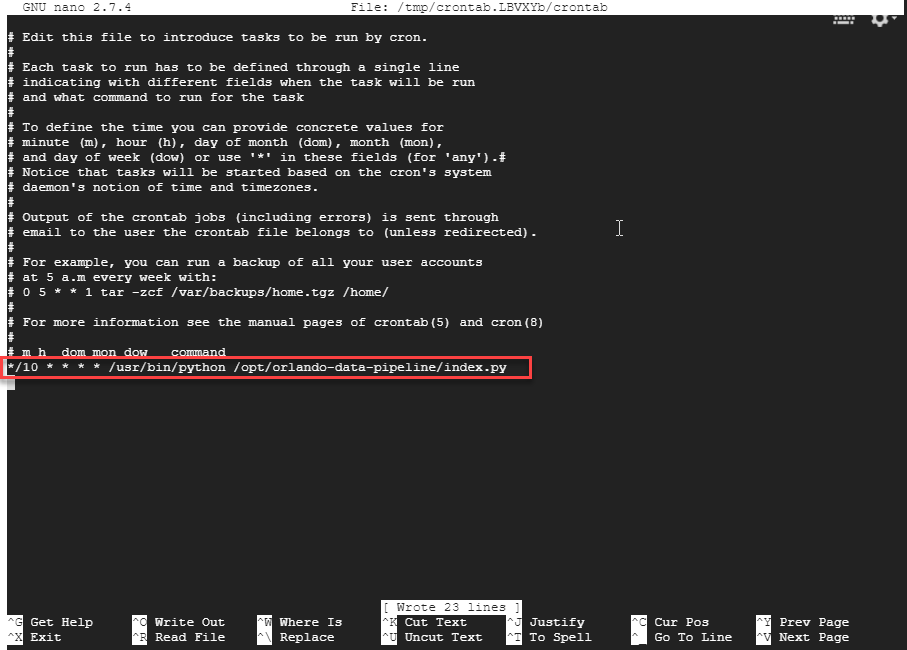
Now my script will run every 10 minutes!
Create Data Studio Report
Time to flip over to data studio and build a visualization!

Select Google Cloud Storage…

Enter the path to the storage bucket and select “Use all files in path”…

After clicking Connect/Reconnect, I can configure the dataset schema…

With that done I can click Create Report and start visualizing data…

I don’t yet have enough data to do more with the visualizations. That’ll be in the next post!
